Songbird: Visualizing Songs Part 1
Introduction
I've been studying machine learning for a few years now, and decided to take on a project while reviewing the fastai tutorial (https://course.fast.ai/). They give an example of how images of sounds can be used to detect which sound is being played, so I had the idea to measure song similarity using a neural network.
The Method
My general idea (which I'm sure is not novel), is to represent time in the song on the x-axis, the frequency on the y-axis, and magnitude of the frequency on the color-axis. My first goal is to pre-process songs so that I have something I can feed to a computer vision learner. My goal is to keep these images as small as possible for training speed while still coming up with a latent representation of the data at a granularity that the network can learn.
First, I have to decide how small I want my time windows to be. I need to output a discrete image with an integer number of pixels. A typical sample rate for a song is 44,100 samples per second, so clearly I'm going to need to choose a window length greater than one. I did some research and testing with Audacity, and found the minimum length of something perceivable other than a click was about 50ms. Doing some math, that means we can choose a window size of 2,205 samples.
Now, on each window I'm going to apply a fast fourier transform, to get the frequencies that are happening in the song in that window. I have to decide how to output my frequencies. The typical range of human hearing is 20hz - 20,000 hz. Again, outputting a 19,800 height pixel image isn't going to be conducive to keeping my training budget low. I did some research and it turns out that a note sounds noticeably out of tune when it is more than 3 hz away from an in-tune note. So, I chose to try 3hz frequency buckets, which is still too large practically, but would give me something to work with. My test input song was stereo, I just added each channel to my buckets, effectively making it mono.
What I found was that the majority of my highest magnitudes were in the 20hz - 1,000 hz range. That makes sense, those are often the fundamental frequencies, high magnitudes above that range are probably overtones. So, I decided to restrict my buckets to 0hz - 1,050 hz, which captures almost everyone's vocal range and most instruments' fundamental frequencies. (a piano can go up to around 4,000 hz, but for my purposes I believe this will capture enough of the song structure).
That gave me a total number of frequency buckets of 350, with a variable number of windows, for a 3 minute song about 3600. I'm going to do grey-scale first, so that will be one byte per pixel, for a total size of 350 * 3600 = 1.26 megabytes. Given that my sample input song was about 30 megabytes, this seems like a useful reduction. I want to cover as much of the range from 0 (black) to 255 (white) in grey-scale to take advantage of my data, while still preserving relative magnitudes. I decided to do the log magnitude times a scale, as there were some big discrepancies of magnitudes. I discovered a scale of 31 works well through experimentation. MP3 encoding normally gives about a 10:1 compression ratio, so the sample input song as an MP3 was 3 megabytes. This gave me a good indication we were preserving the majority of the song's human perceivable information.
Iteration

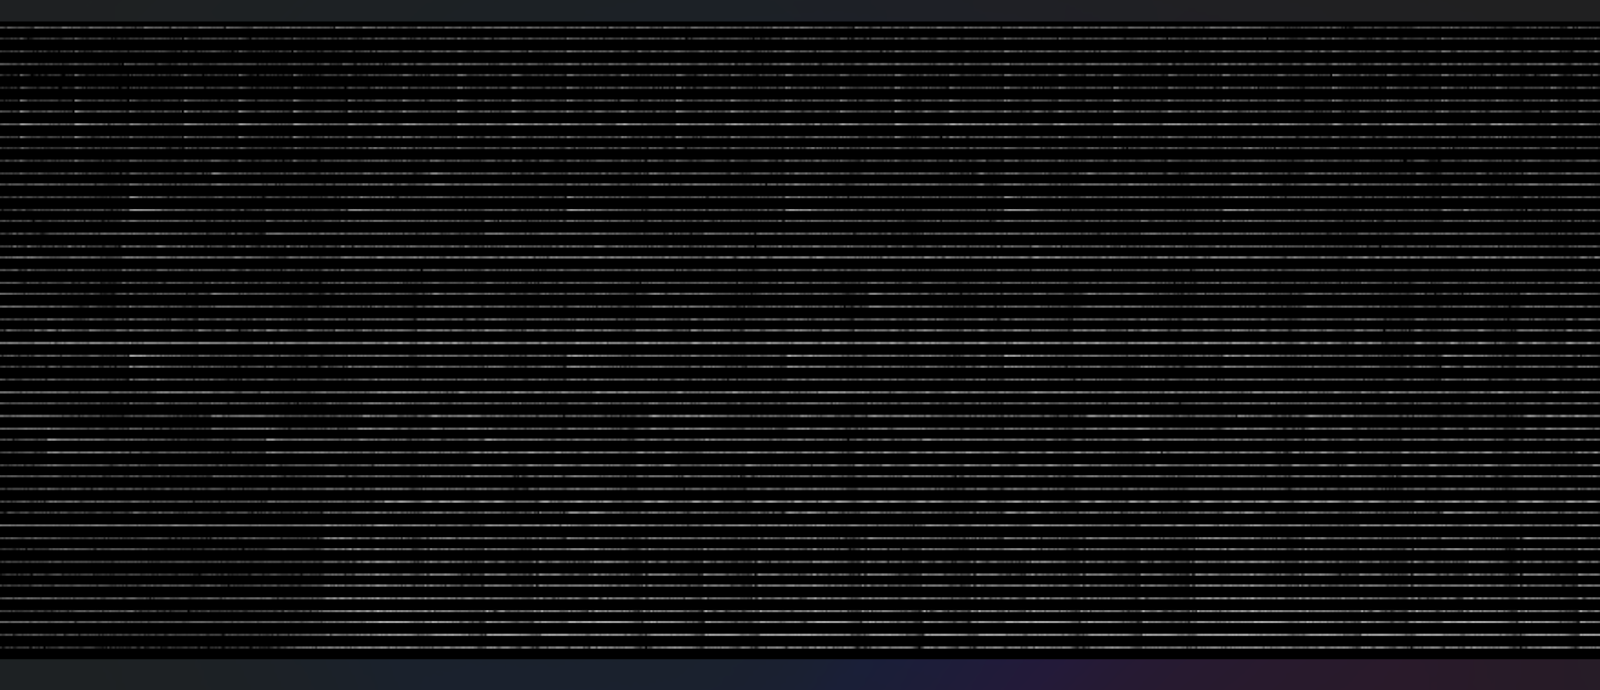
Above you can see part of an example output from the current process. I like some things about this. First, the song starts quieter and then builds, which I can hear in the actual song. I can see some clear notes where the magnitude is high and fades away. And we have consistent white and black lines, where the white lines probably represent in-key notes and the black out-of-key notes.
However, the white lines are very consistent, which makes me think that some of that magnitude is from overtones of lower frequencies. These overtones do give us some information (they typically could tell you which specific instrument is playing as different instruments have different overtones), however I would like a more clear picture of what notes are being played at what time, so I decided to attempt to mute them somewhat. (This is an unavoidable trade off, the better we understand when a note is played the less we will be able to tell with what magnitude the note was played.)
What I did, is for each frequency, I took integer multiples of them up until the ceiling of our range (1050hz) and subtracted those magnitudes away from those frequency buckets. This is because for most instruments, overtones are integer multiples of their fundamental frequencies.

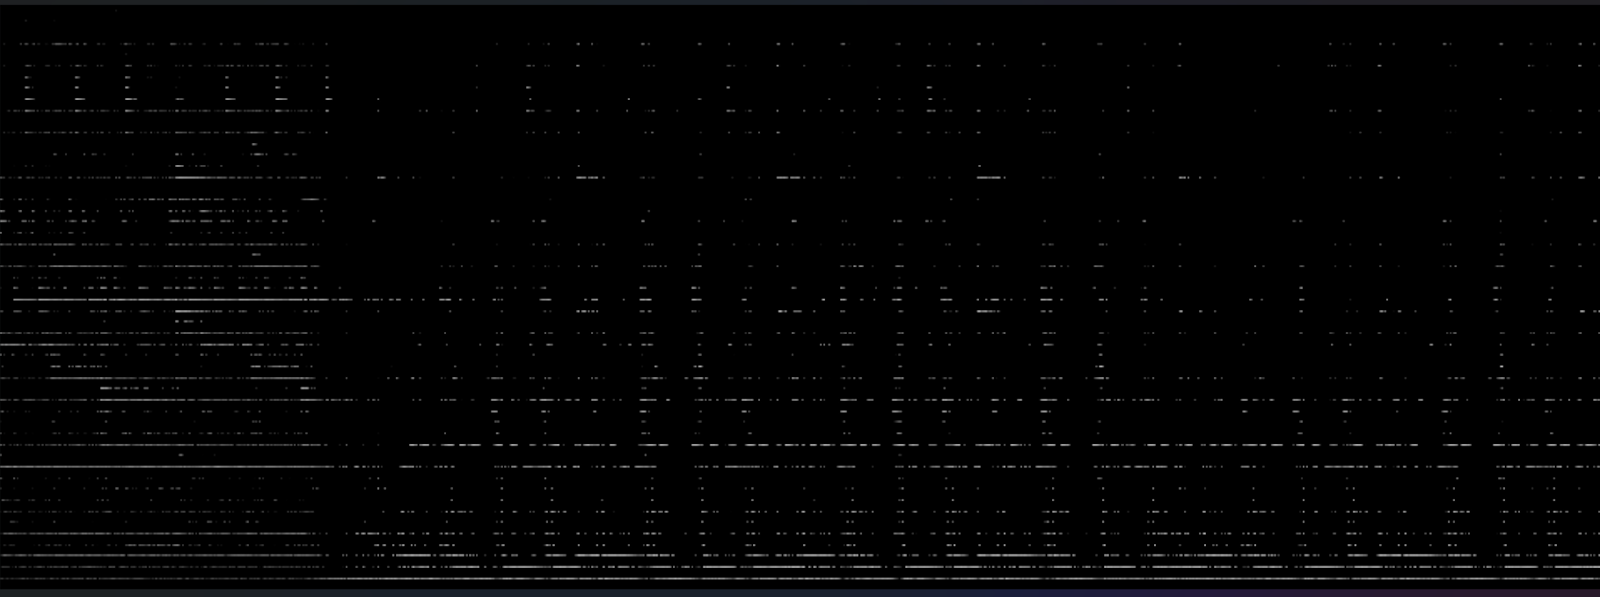
This gave me a result like above. I like that I'm seeing more separation between notes which seems valid, however I note that the upper frequency ranges have been decimated. I think lower drum beats and bass tones are wiping out values above them. I made my approach a little more complex, dividing the frequencies into three bands. The low band is 0hz - 80hz, the mid from 80hz - 400hz, and the high from 400hz to 1050hz. I only removed overtones from low band frequencies in the low band, mid band in the mid band, and so on. I would hope that this would preserve more of the mids and highs, which should really compose a lot of the magnitude of most music.

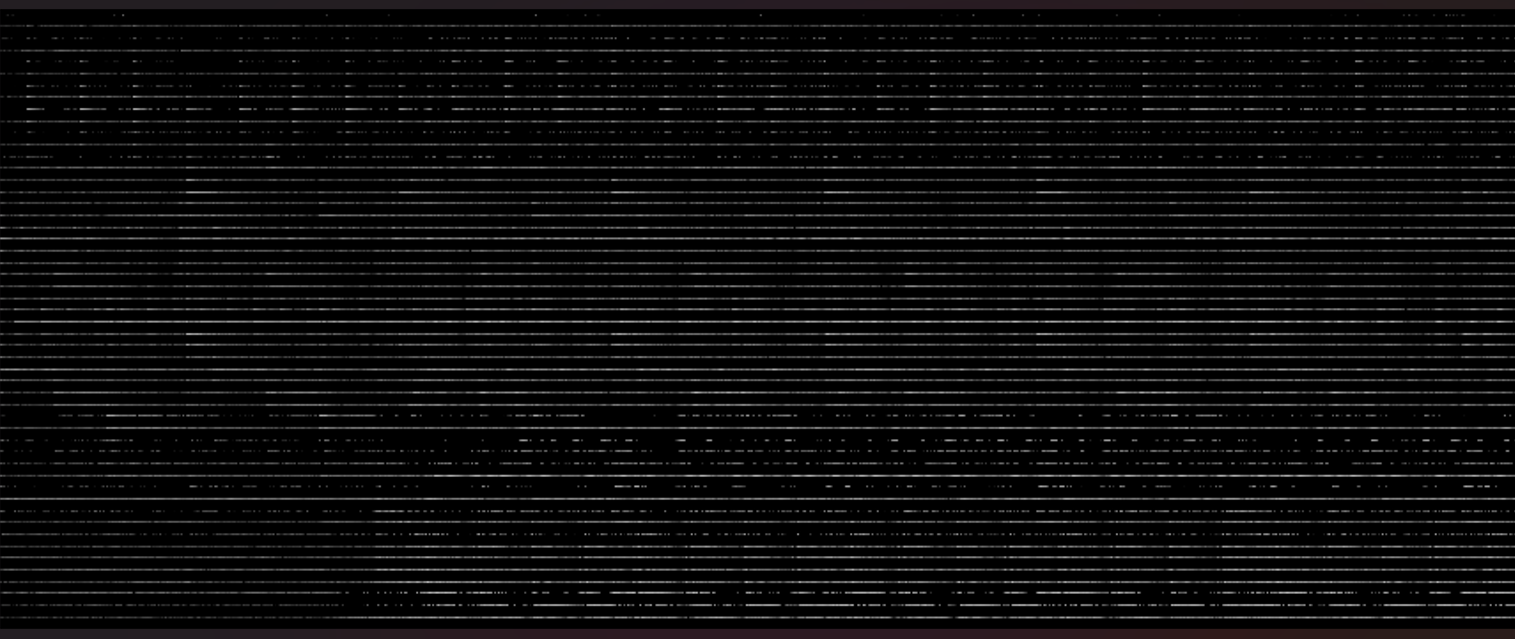
This is the result of the second version of my overtone removal experiment. I like that I can see clear bands here, with more of my high magnitudes coming in the mid range. I'm pretty happy that this is a good visual representation of the song. I did a couple more sanity checks, reducing the volume of the song using Audacity and confirming that I saw less lighter shades, and silencing part of the audio and ensuring I didn't see any output at those times.
Next Steps
The next phase will be labeling some images to train our model. This is actually an interesting problem, as there isn't exactly an objective measure of song similarity. I think the features I would use are genres, instruments present, tempo, and key, and come up with some type of scoring system based on that as labels. Then we can train our network!
© 2025 Jon Crain. All Rights Reserved.